Cloudiness
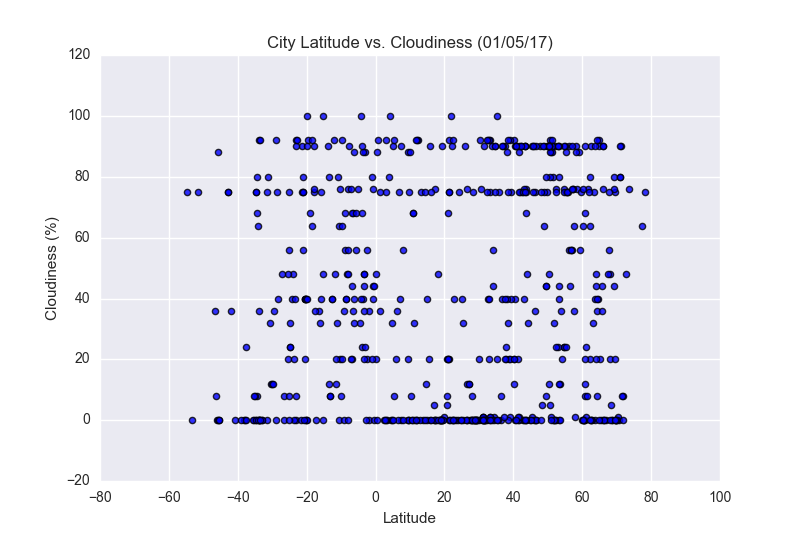
Based on the chart, there isn't an obvious trend between latitude and cloudiness. Interestingly, the vast majority of cloudiness measurements are either above 70% or at or below 20% across the globe. Very few places fall between 20% and 70% at the time the data was collected. This may be an indication of the inherent tendency of cloudiness, but confirmation of that will require further research.
Visualizations